
Workplace Safety Statistics — Quick Answer (Australia)
Safe Work Australia publishes annual workplace injury and fatality statistics, drawing on its Australian Workers' Compensation Statistics dataset (accepted serious workers' compensation claims by industry, mechanism and body part) and its Work-Related Traumatic Injury Fatalities dataset (work-related deaths). These feed the flagship Key Work Health and Safety Statistics Australia publication released annually. Roughly six industries — Agriculture/Forestry/Fishing, Public Administration & Safety, Transport/Postal/Warehousing, Manufacturing, Health Care/Social Assistance and Construction — together account for the majority of both serious claims and work-related fatalities. The full statistics breakdown sits in the body below.
What are the most common workplace injuries in Australia?
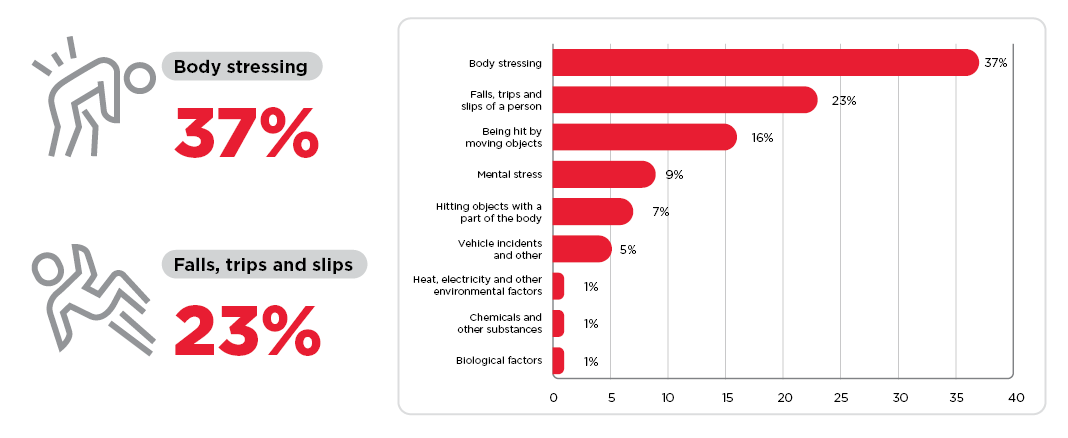
The most frequently reported causes of serious workers' compensation claims in Australia are typically: body stressing (muscular strain, sprain, lifting and repetitive movement injuries), falls, trips and slips on the same level, being hit by moving objects, and falls from a height. Body stressing alone usually accounts for around a third of all serious claims (approximately 33% in the most recent SWA reporting period). Pull the latest Safe Work Australia statistics for current-year figures.

One of the core functions of Safe Work Australia (SWA) is to develop and maintain an evidence base to inform WHS and workers’ compensation policies and practices.
Yearly, it publishes key work health and safety (WHS) figures that present an overview of the latest national work-related injury, disease and fatality statistics.
Update: The 'Key Work Health and Safety Statistics Australia 2023' data is out: https://data.safeworkaustralia.gov.au/insights/key-whs-stats-2023

For the most up-to-date WHS data, please refer to the SWA's August 2023 launch of https://data.safeworkaustralia.gov.au, where "data to analyse and research work health and safety and workers' compensation trends across Australia" are compiled in an interactive format.
Disclaimer: The key statistics and images below are directly taken from and attributed to SWA under Creative Commons 4.0. No copyright infringement is intended.
Work-related fatalities
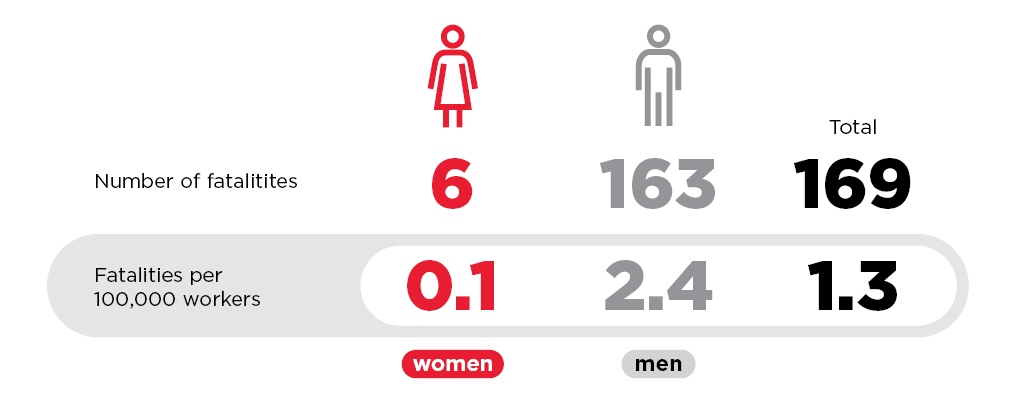
- 190 Australian workers died at work due to work-related causes
- 1.4 deaths per 100,000 workers over the past five years (2018 to 2022)
Overall, documented fatalities due to occupational causes have been decreasing since the 2007 peak, but are slowly rising again since the 2018 trough:

(Excludes work-related fatalities resulting from diseases, natural causes and suicides)
From 2016 to 2021, way more males suffered work-related deaths than females.
2021:
| 2020 | 2019 | 2018 | 2017 | 2016 |
 |
 |
 |
|
 |
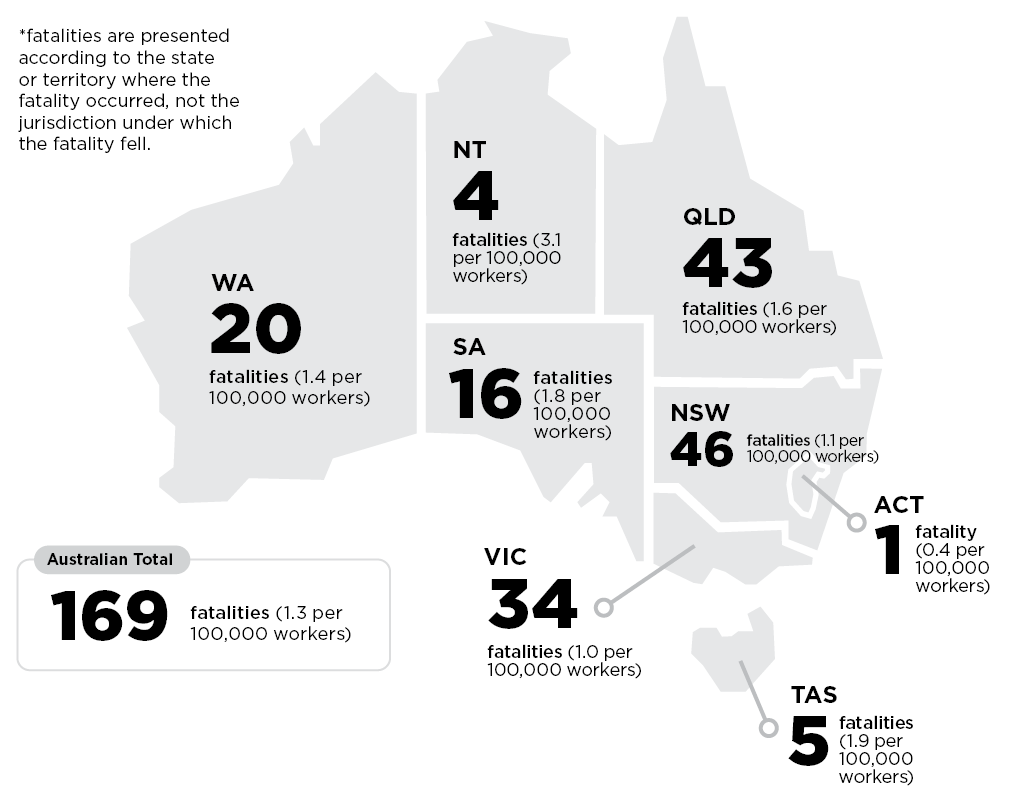
The highest number of work-related deaths were recorded in New South Wales.
2021:
| 2020 | 2019 | 2018 | 2017 | 2016 |
 |
 |
 |
 |
 |
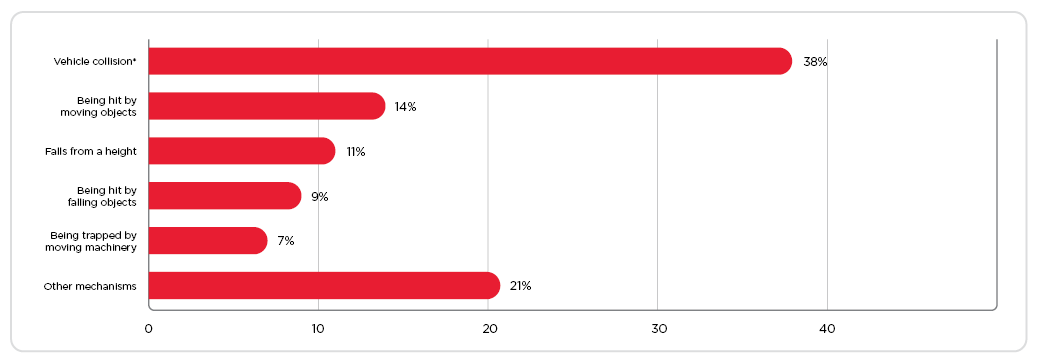
Most deaths were the result of vehicle collisions (eg. car, truck, aircraft, boat, loader, tractor, quad bike etc.). From 2016 to 2021, the third leading cause of death was falls from heights (except in 2019, when it was tied with “being hit by moving objects” as the second leading cause of death).
2021:
| 2020 | 2019 | 2018 | 2017 | 2016 |
 |
 |
 |
 |
 |
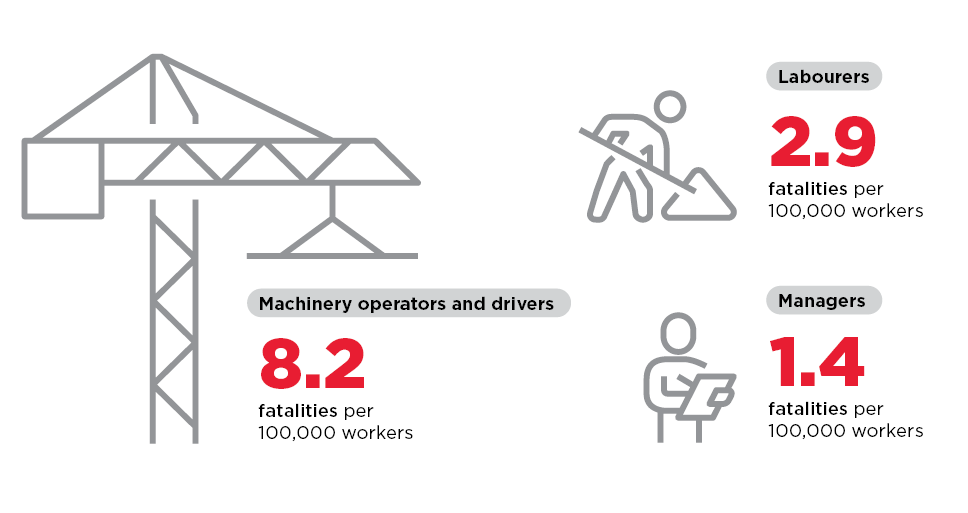
Most fatality victims were machine operators and drivers or, essentially, those who work with or near vehicles (top cause of death, see the previous figure).
2021:
| 2020 | 2019 | 2018 | 2017 | 2016 |
 |
 |
 |
 |
 |
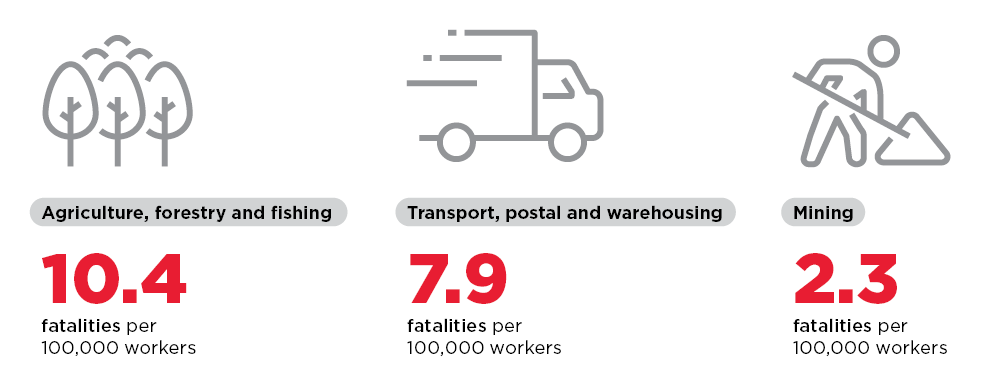
“Agriculture, forestry and fishing” remain the industries where most fatalities were recorded.
2021:
| 2020 | 2019 | 2018 | 2017 | 2016 |
 |
 |
 |
 |
 |
Work-related injuries and diseases
Here are the 2022 figures from SWA based on preliminary estimates.
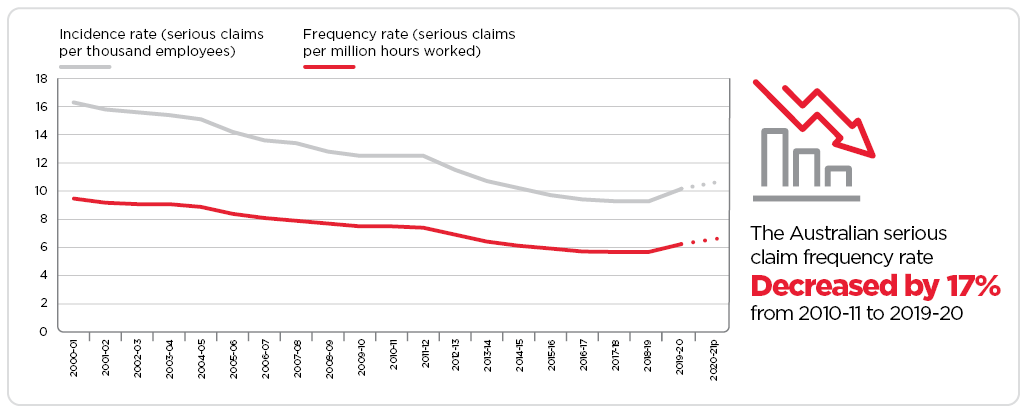
There were significantly more serious claims filed compared to the preceding years:
| 2020 - 2021 | 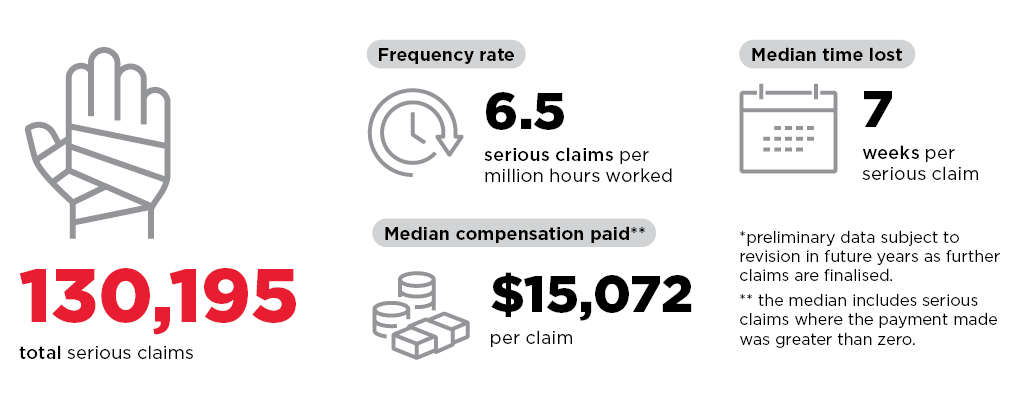 |
| 2019 - 2020 |  |
| 2018 - 2019 |  |
| 2017 - 2018 |  |
| 2016 - 2017 |  |
“Body stressing” and “falls, slips and trips” have remained the top two mechanisms of incident since 2016.
2021:
| 2019 - 2020 | 2018 - 2019 | 2017 - 2018 | 2016 - 2017 |
 |
 |
 |
 |
Roughly 7 out of 10 serious claims filed resulted in injuries, most of which were classified as traumas to the joints, ligaments, muscles and tendons.
2021:

| 2019 - 2020 | 2018 - 2019 | 2017 - 2018 | 2016 - 2017 |
 |
 |
 |
 |
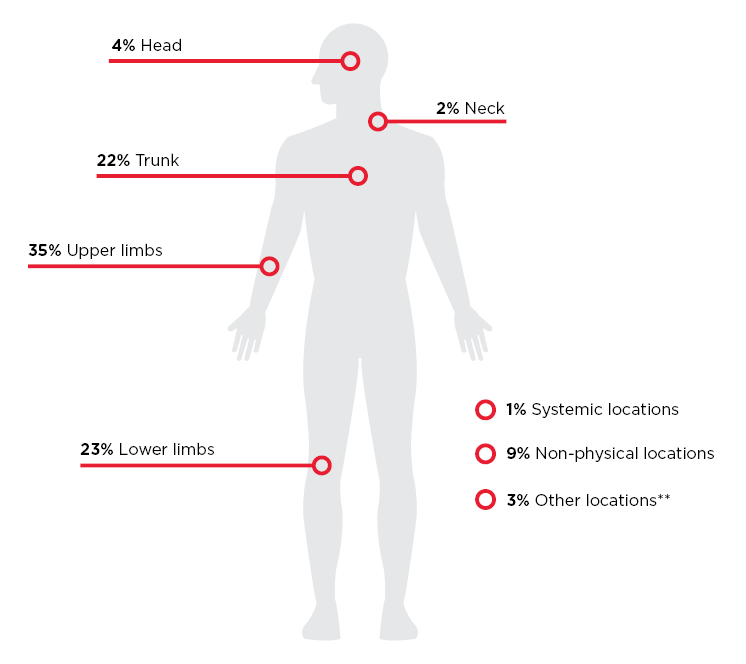
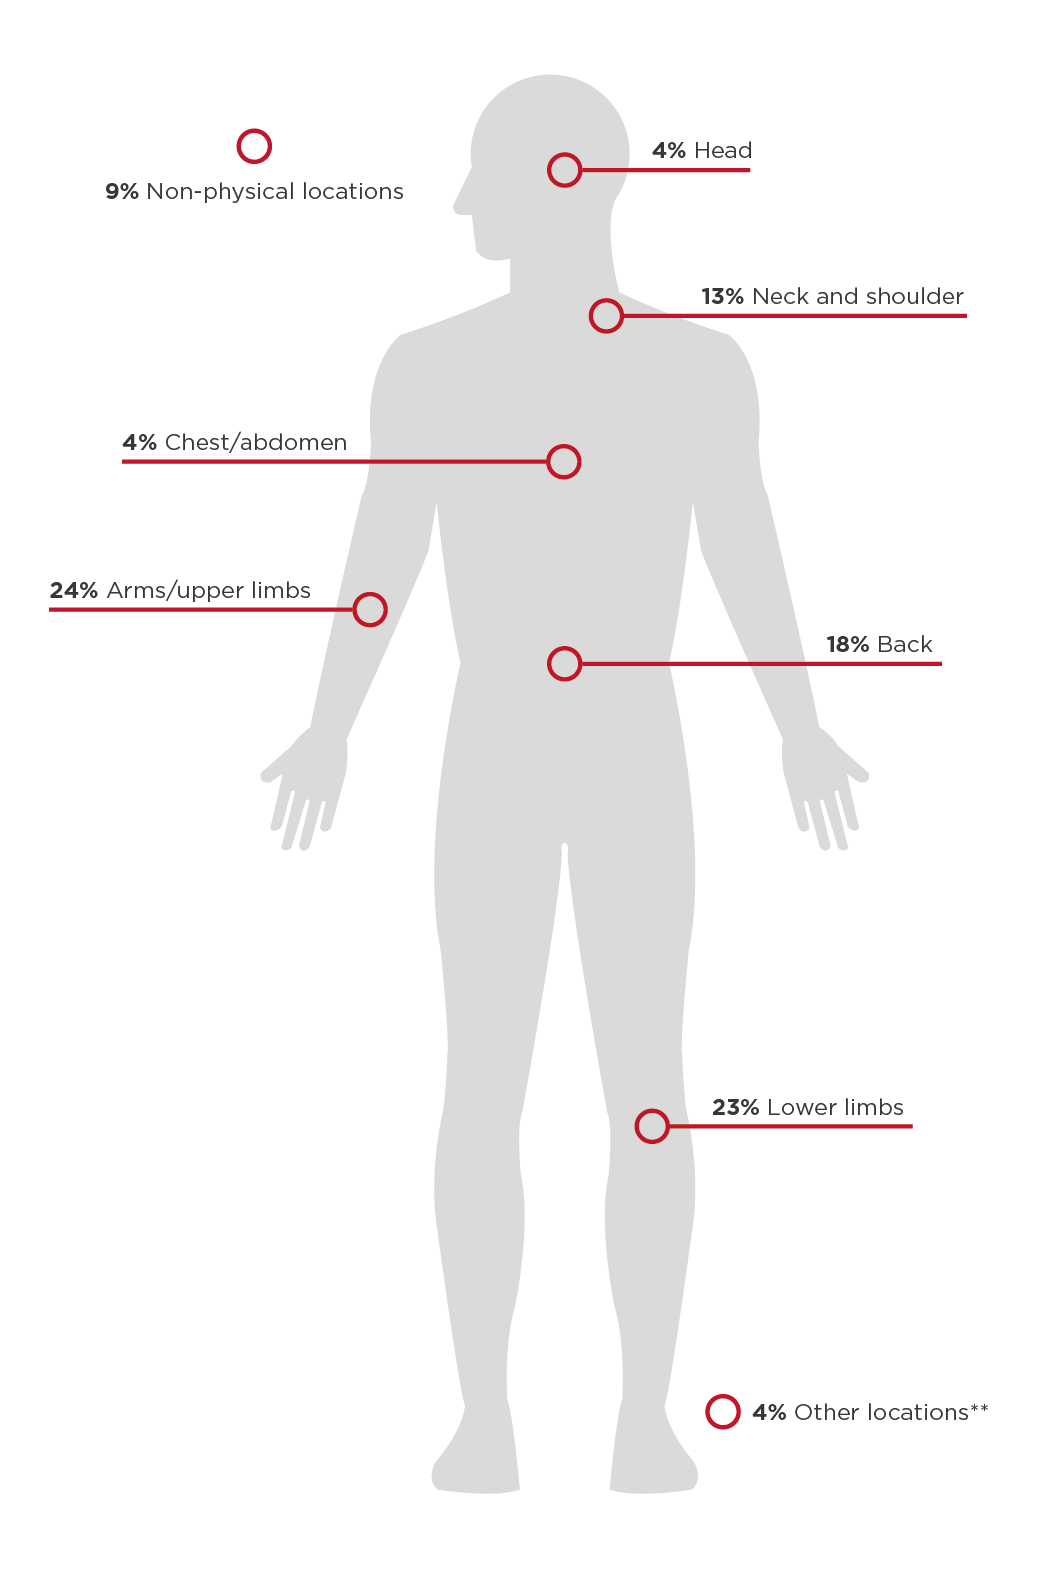
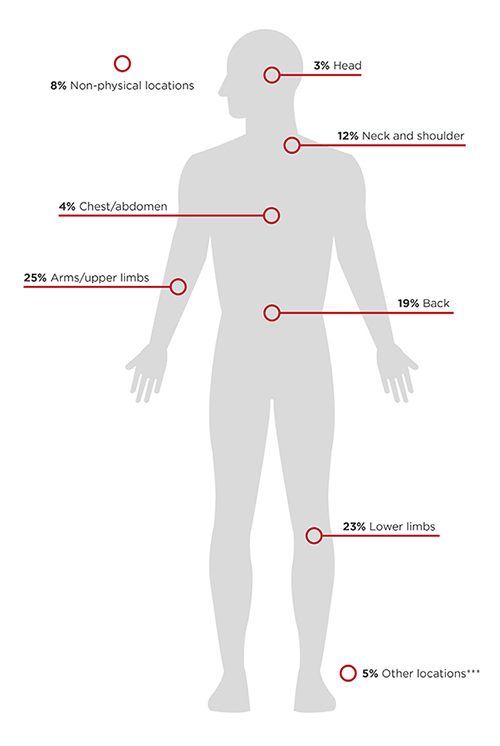
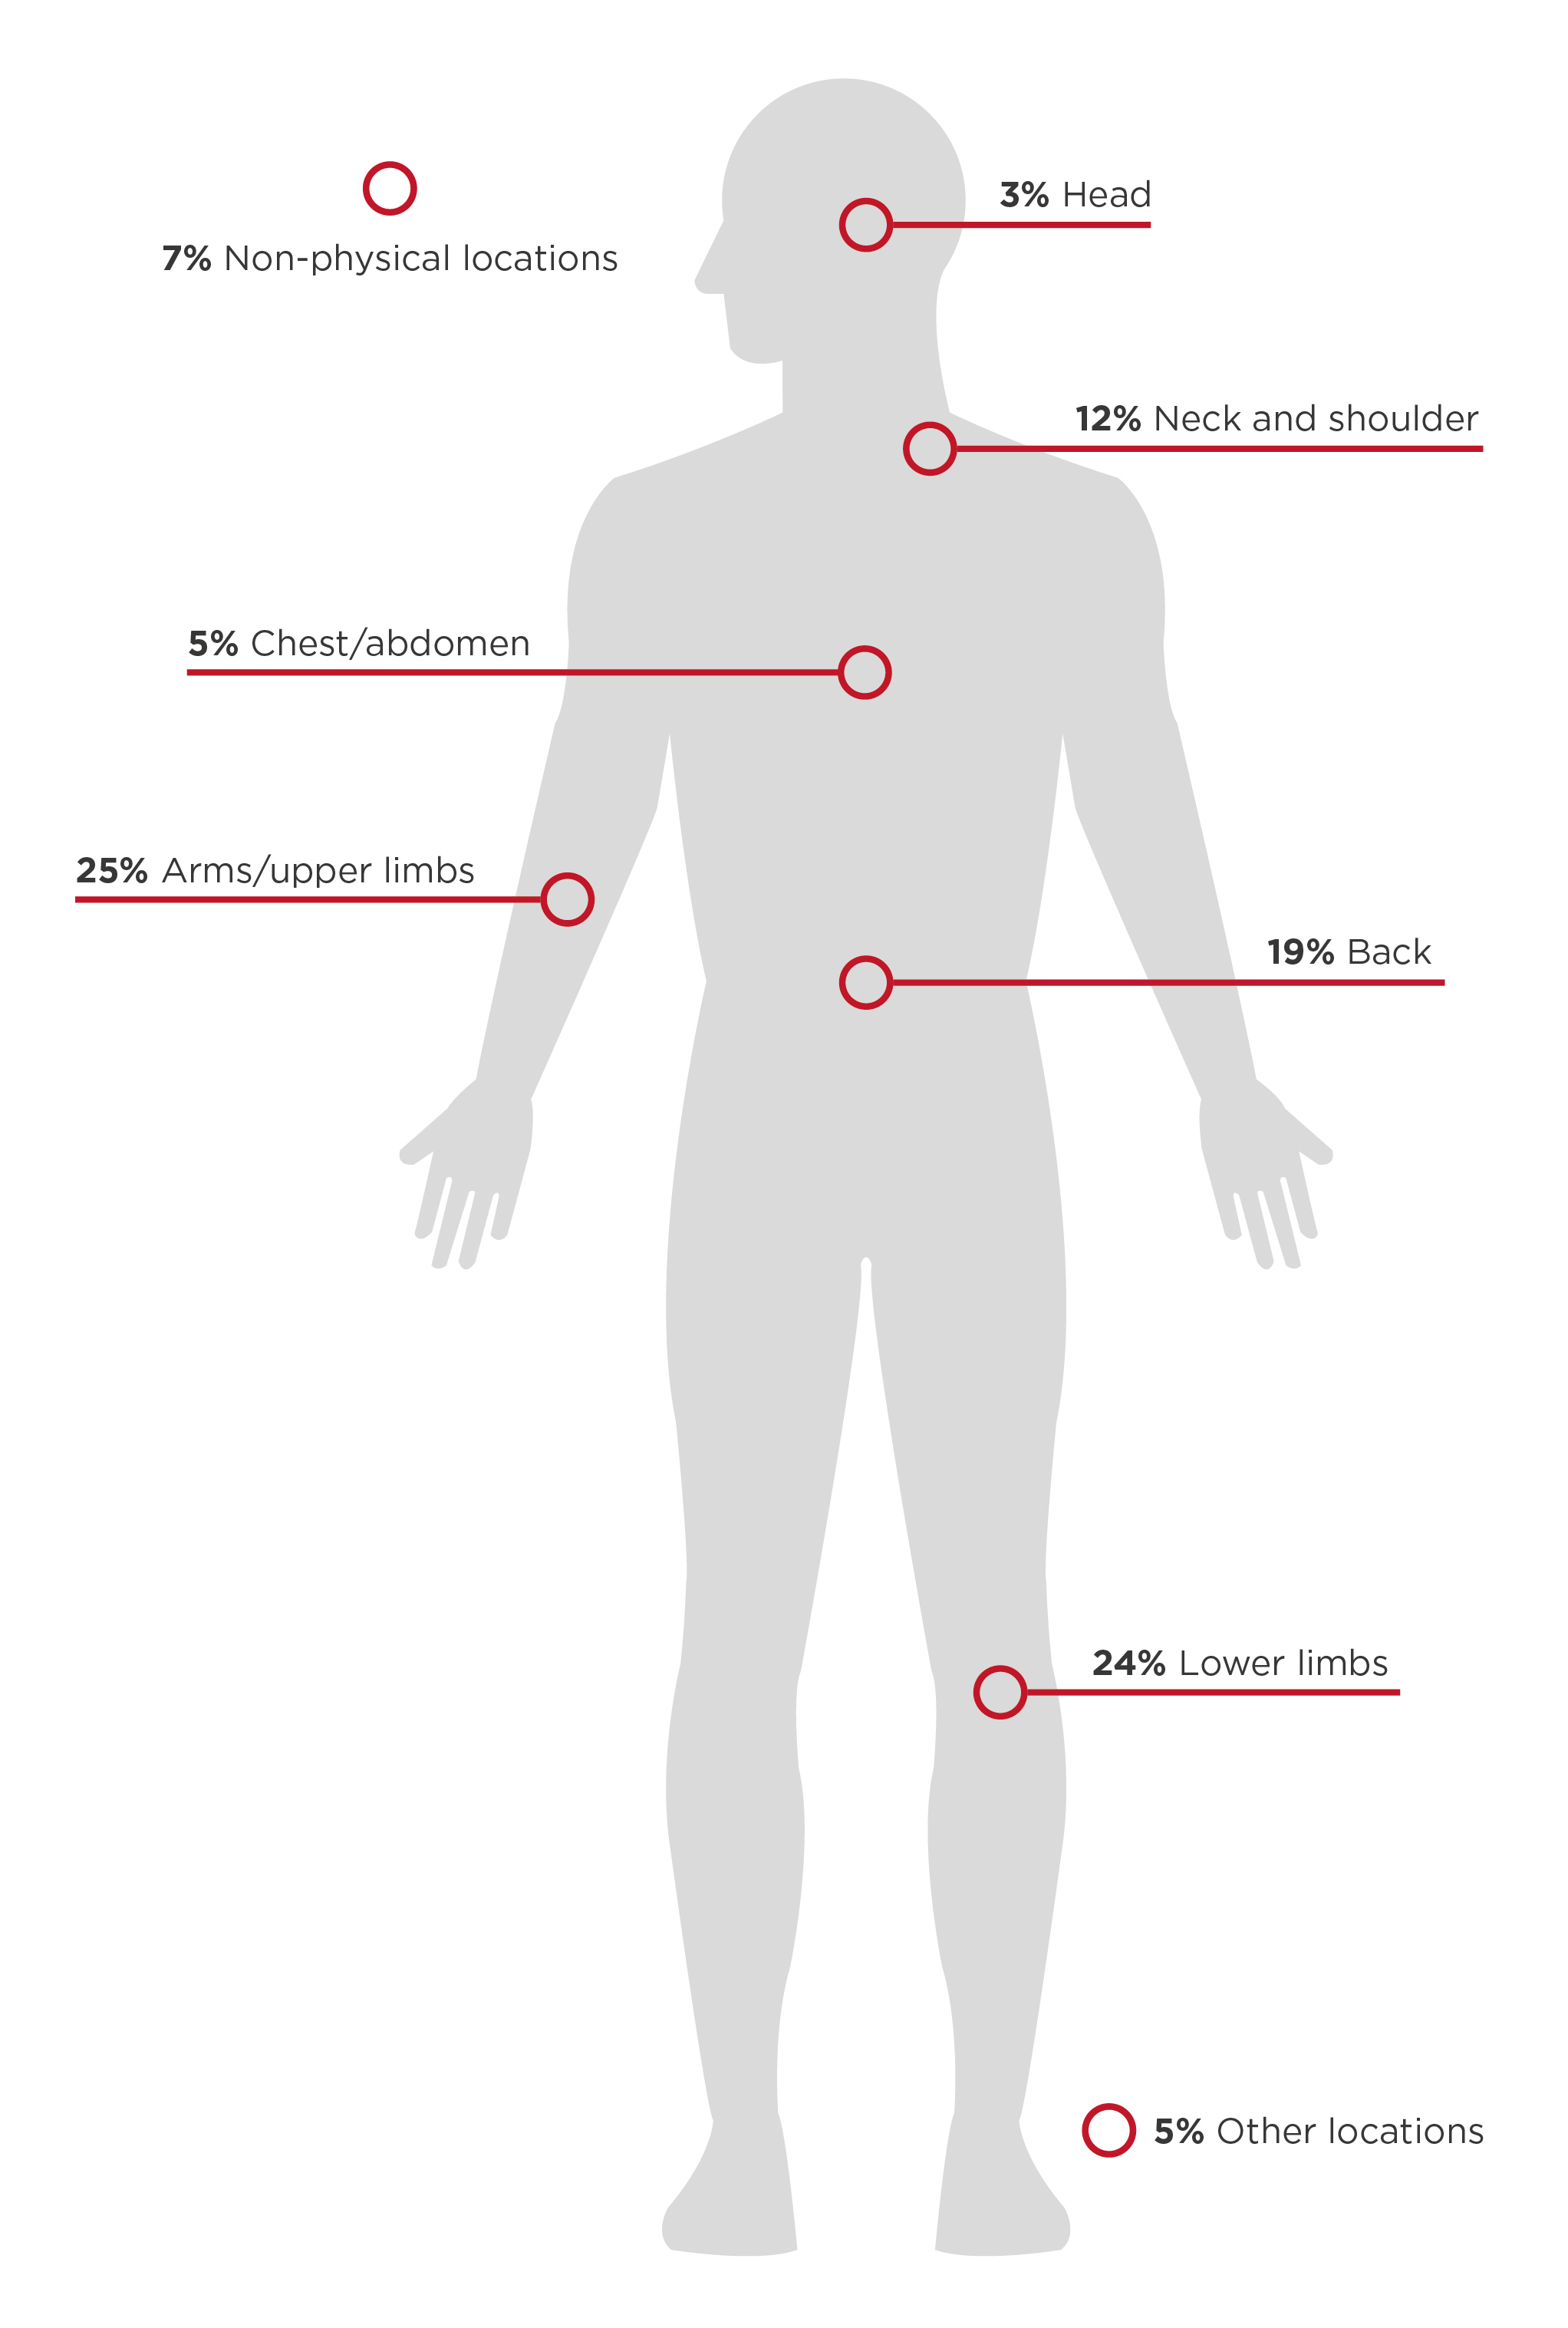
The injuries were still mostly to the upper and lower limbs.
2021:
| 2019 - 2020 | 2018 - 2019 | 2017 - 2018 | 2016 - 2017 |
 |
 |
 |
 |
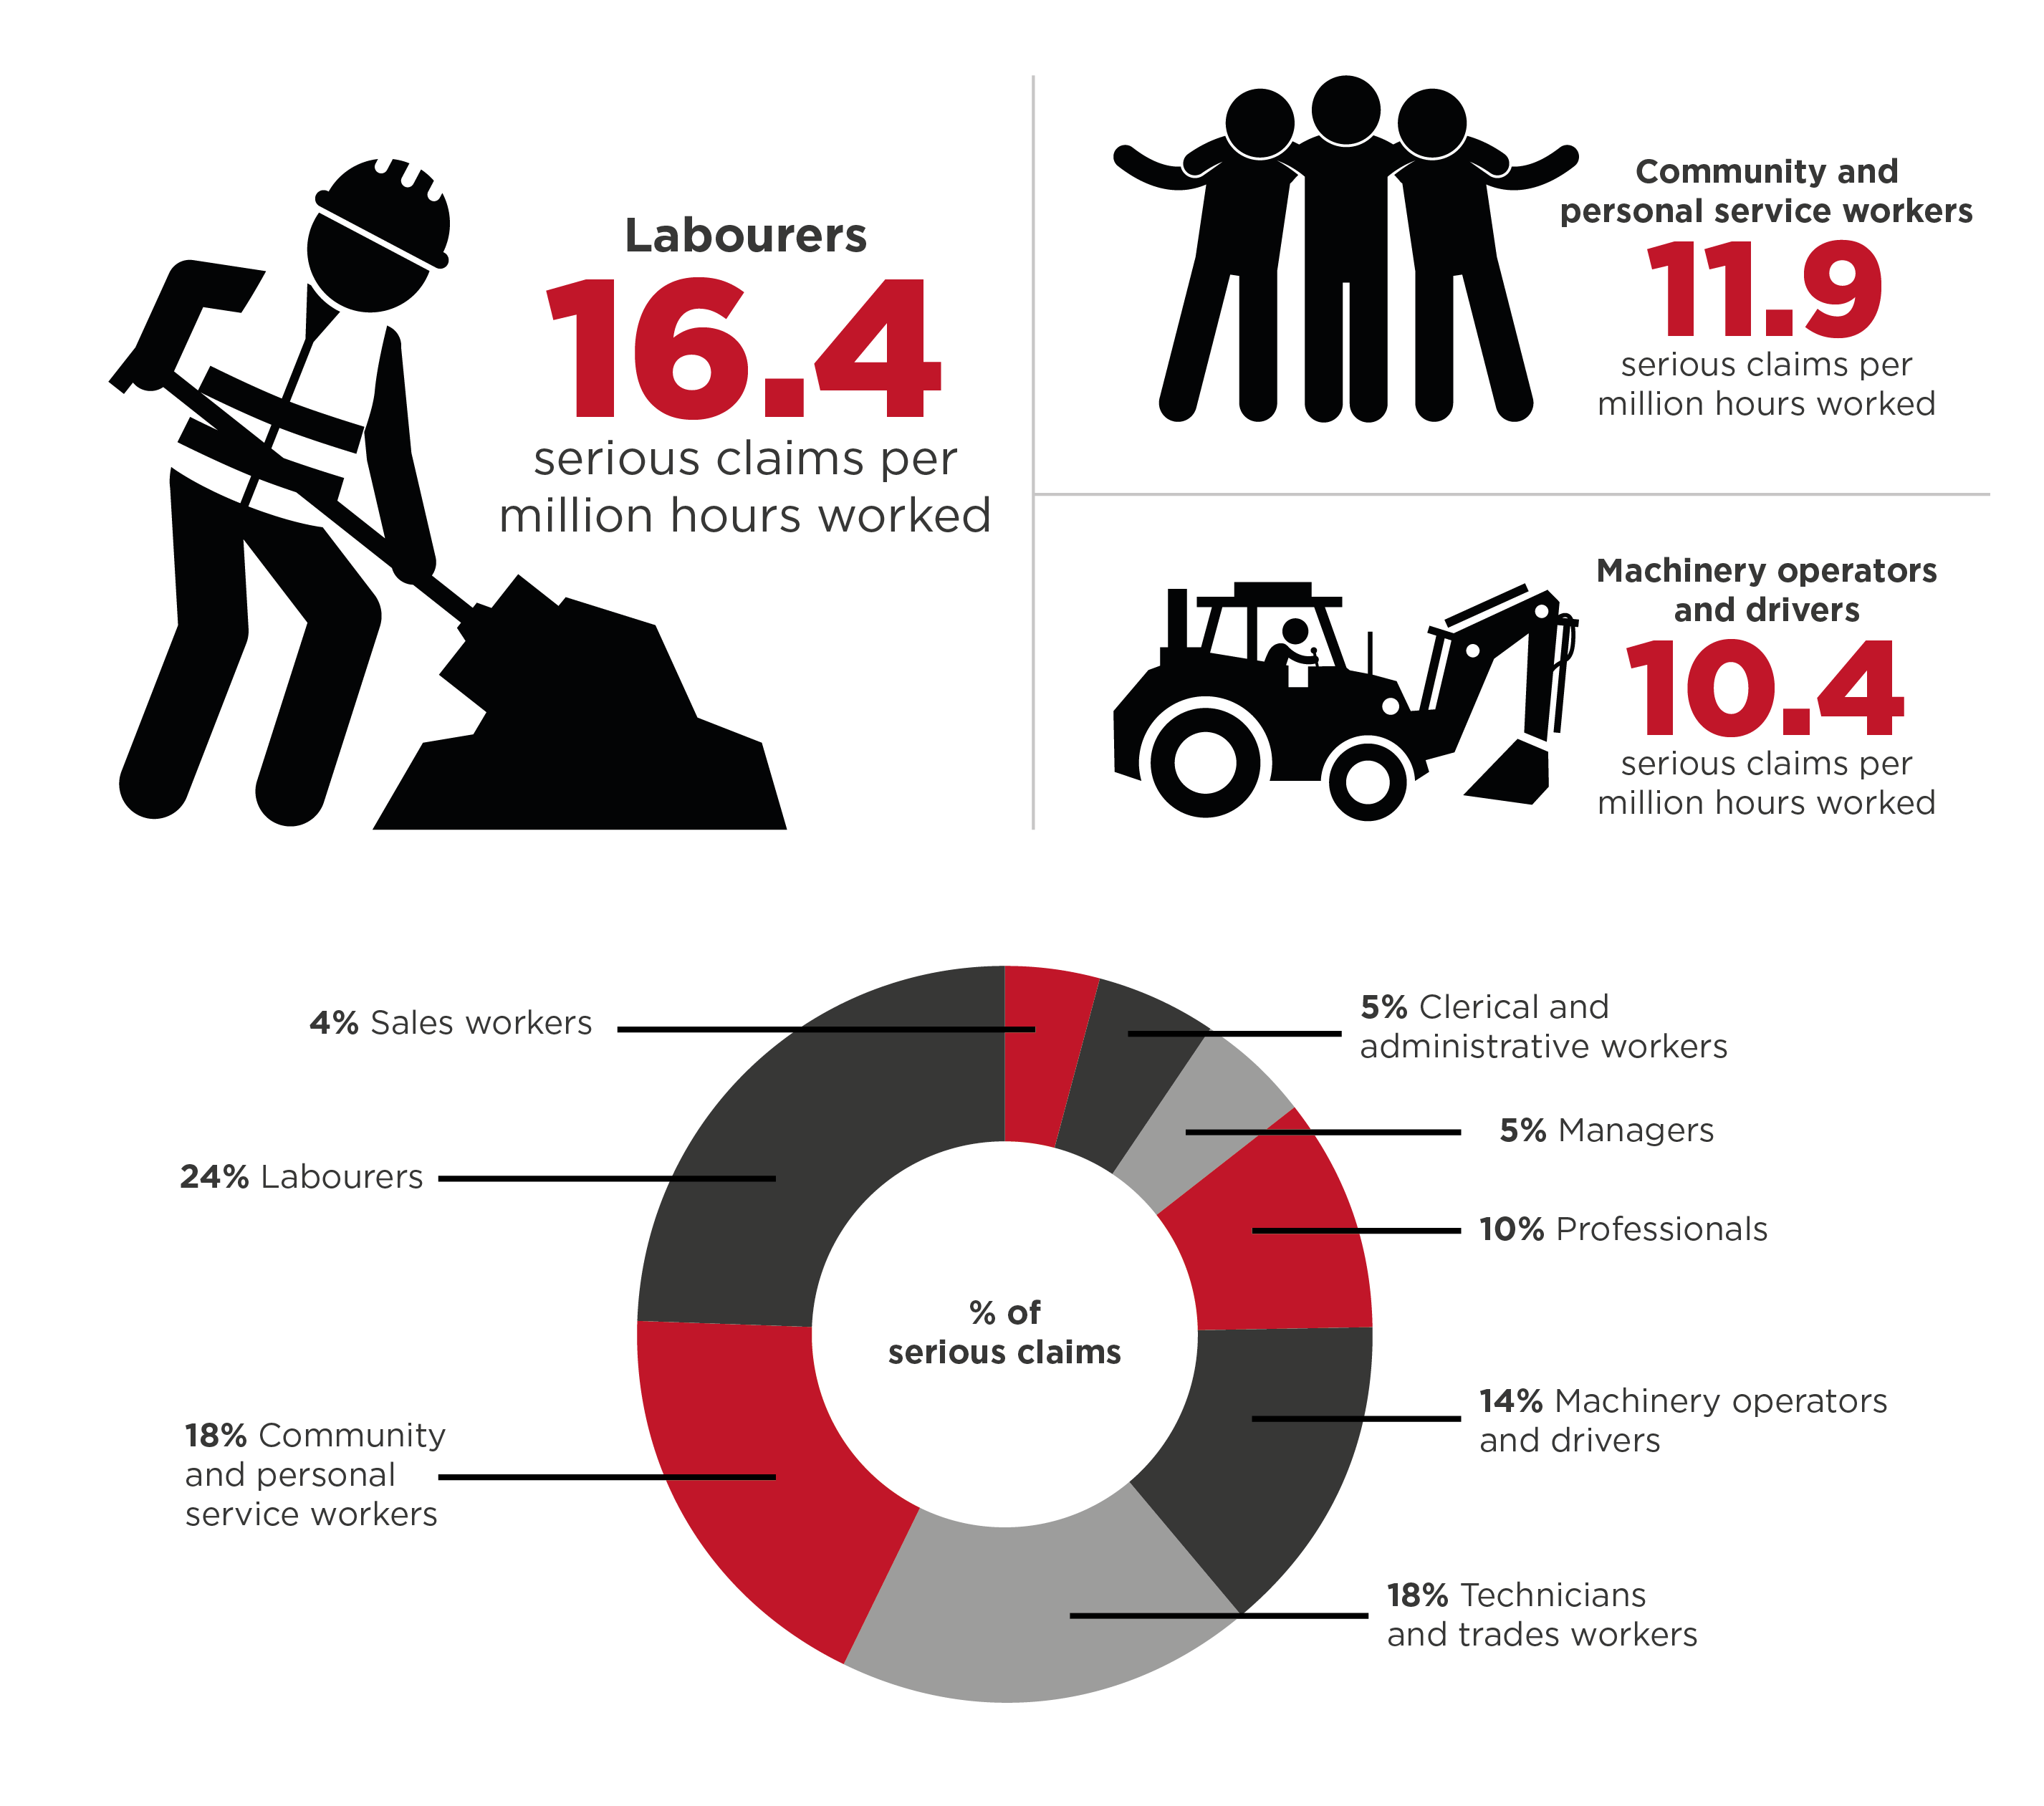
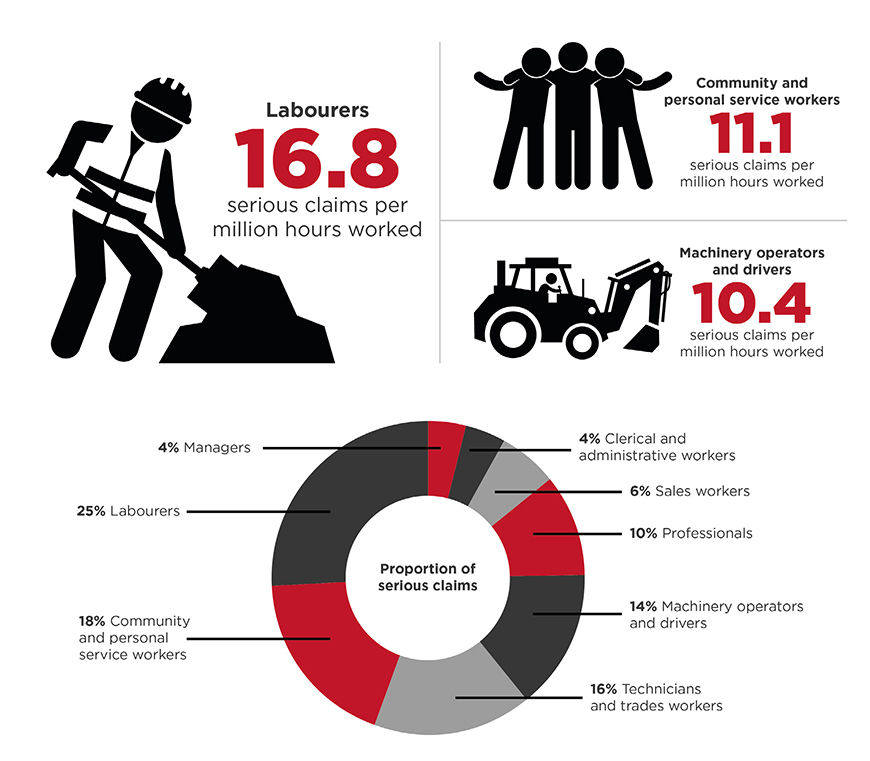
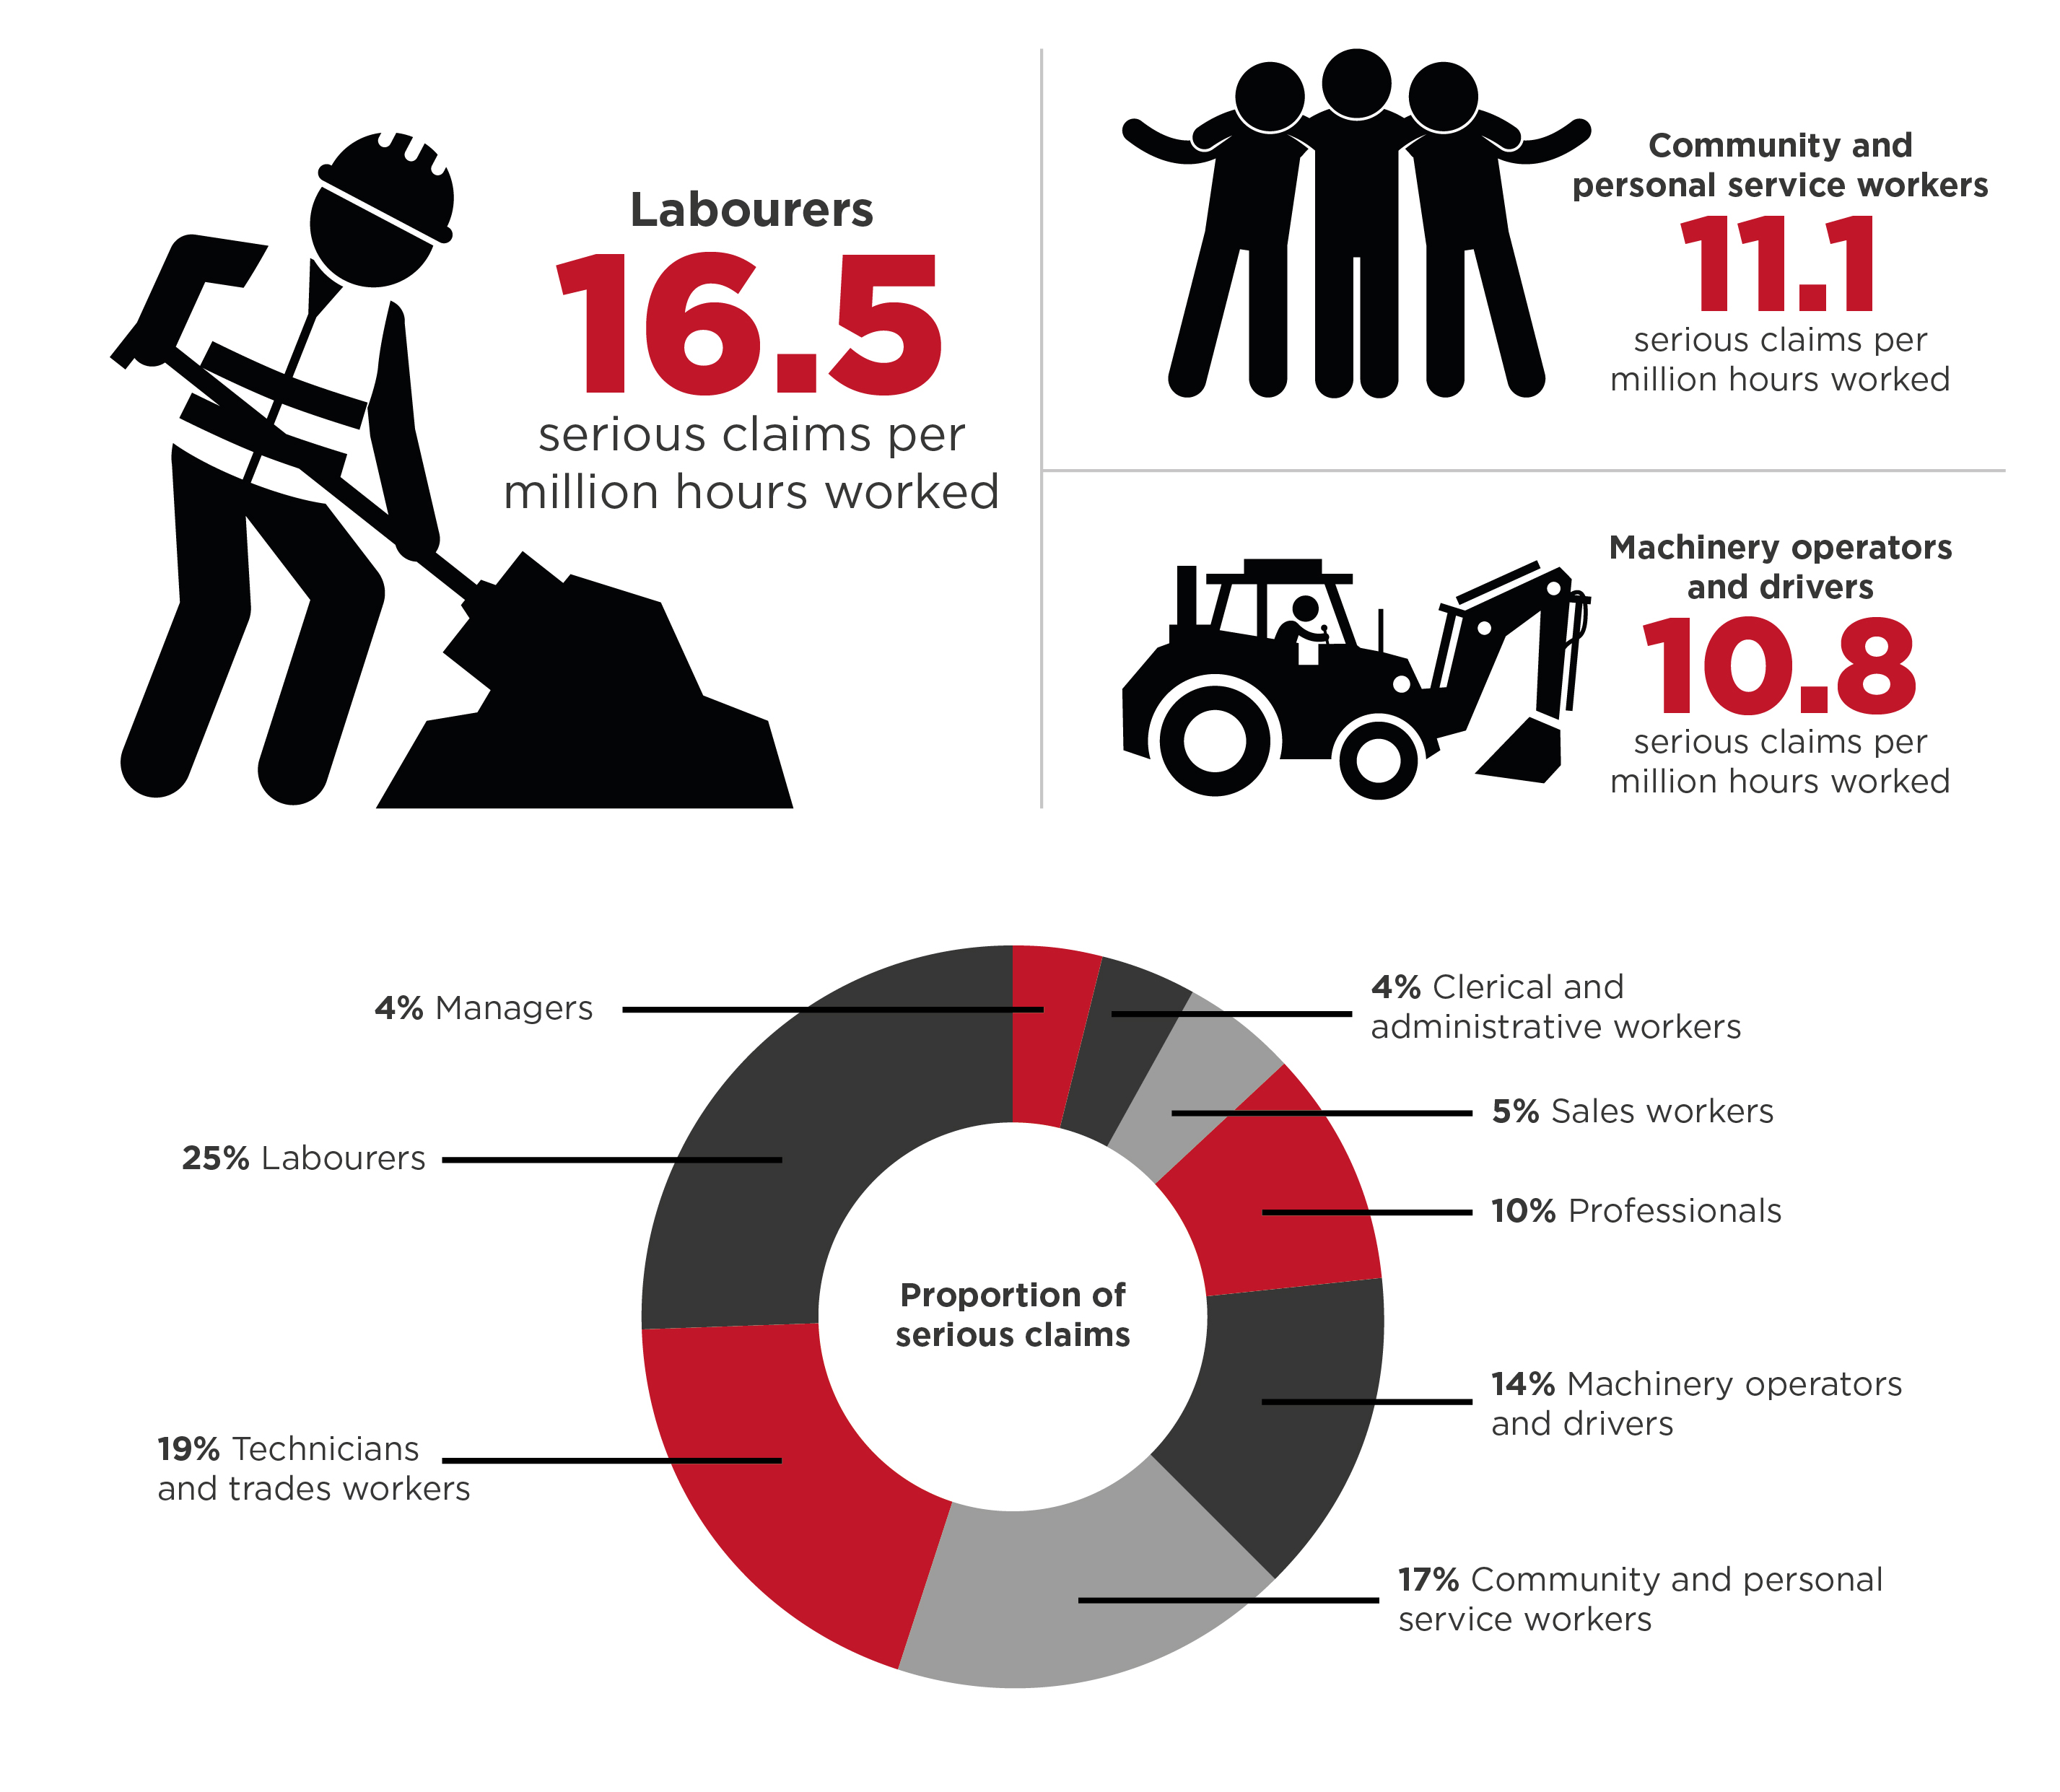
In terms of occupation, those who filed for serious claims were mostly labourers, followed by community and personal service workers and machinery operators and drivers.
| 2019 - 2020 | 2018 - 2019 | 2017 - 2018 | 2016 - 2017 |
 |
 |
 |
 |
We'll continue to monitor the SWA’s release of updated information and amend the figures accordingly. Make sure to subscribe to our newsletter below so you don’t miss the update.
AIMS' Note on Buying PPE and Workwear
- Hazard assessment: Identify the specific hazards you will likely be facing in your work environment. Consider potential risks such as chemical exposure, falling objects, loud noises, electrical hazards or biohazards. This assessment will guide you in selecting the appropriate PPE for the job.
- Appropriate materials: Different materials offer various protective qualities. Consider flame-resistant (FR) materials for fire hazards, chemical-resistant fabrics for handling hazardous liquids and high-visibility options for work in low-light environments.
- Compliance to occupational safety standards: Opt for PPE that meets the pertinent Australia Standard (AS), although some brands -- especially imports -- will have other compliance markings such as ANSI, OSHA, ANSI, NIOSH, oSA etc. Look for certifications on the product label to ensure the equipment has undergone rigorous testing.
- Proper fit and comfort: Proper fit is crucial for both comfort, dexterity and protection. Ill-fitting clothing can snag on machinery or restrict movement, potentially creating additional hazards. Choose sizes that allow for layering in cold weather without being overly bulky and consider adjustable options for items like hard hats or respirators.
- Maintenance and replacement: Inspect PPE before each use for signs of wear, tear or damage. Follow (and factor in) the manufacturer's instructions for cleaning and storage. Some materials may require specialised laundering, while others can be machine-washed. Check for durability to ensure the clothing can withstand frequent use and cleaning. Replace damaged or expired PPE immediately to guarantee your safety.
- Training: Ensure you and any employees understand how to properly use, wear, adjust, maintain and store PPE and workwear. Improper use can negate its protective benefits.


Pair this with our Hard Hat Guide Australia for AS/NZS 1801 compliance and site colour conventions.
People Also Ask — Australian Workplace Safety Statistics
Q: Which industries record the highest work-related fatality rates in Australia?
According to Safe Work Australia's annual statistics, Agriculture/Forestry/Fishing, Transport/Postal/Warehousing, and Construction consistently record the highest work-related fatality rates. These three industries together account for a disproportionate share of all worker deaths.
Q: What is the most common cause of serious workers' compensation claims in Australia?
Body stressing — muscular strains and sprains from manual handling and lifting — is consistently the leading cause of serious workers' compensation claims, followed by falls on the same level and being hit by moving objects or equipment.
Q: Where can I find the latest Australian workplace safety statistics?
Safe Work Australia publishes the Work-related Traumatic Injury Fatalities report and the Work-related Injuries and Illnesses in Australia report annually. Data is also available through the Safe Work Australia online statistics portal at safeworkaustralia.gov.au.
Q: What is the difference between a work-related fatality and a serious injury claim?
A work-related fatality is a death arising from a traumatic work-related event. A serious workers' compensation claim is defined as a claim resulting in one or more weeks away from work. These are tracked separately and reported through different Safe Work Australia publications.
Q: Why do WHS statistics matter for procurement and maintenance teams?
Understanding which injury types are most common in a given industry helps maintenance managers and procurement teams prioritise their PPE and safety equipment investment, targeting the highest-frequency and highest-severity risks first rather than spreading spend broadly.


